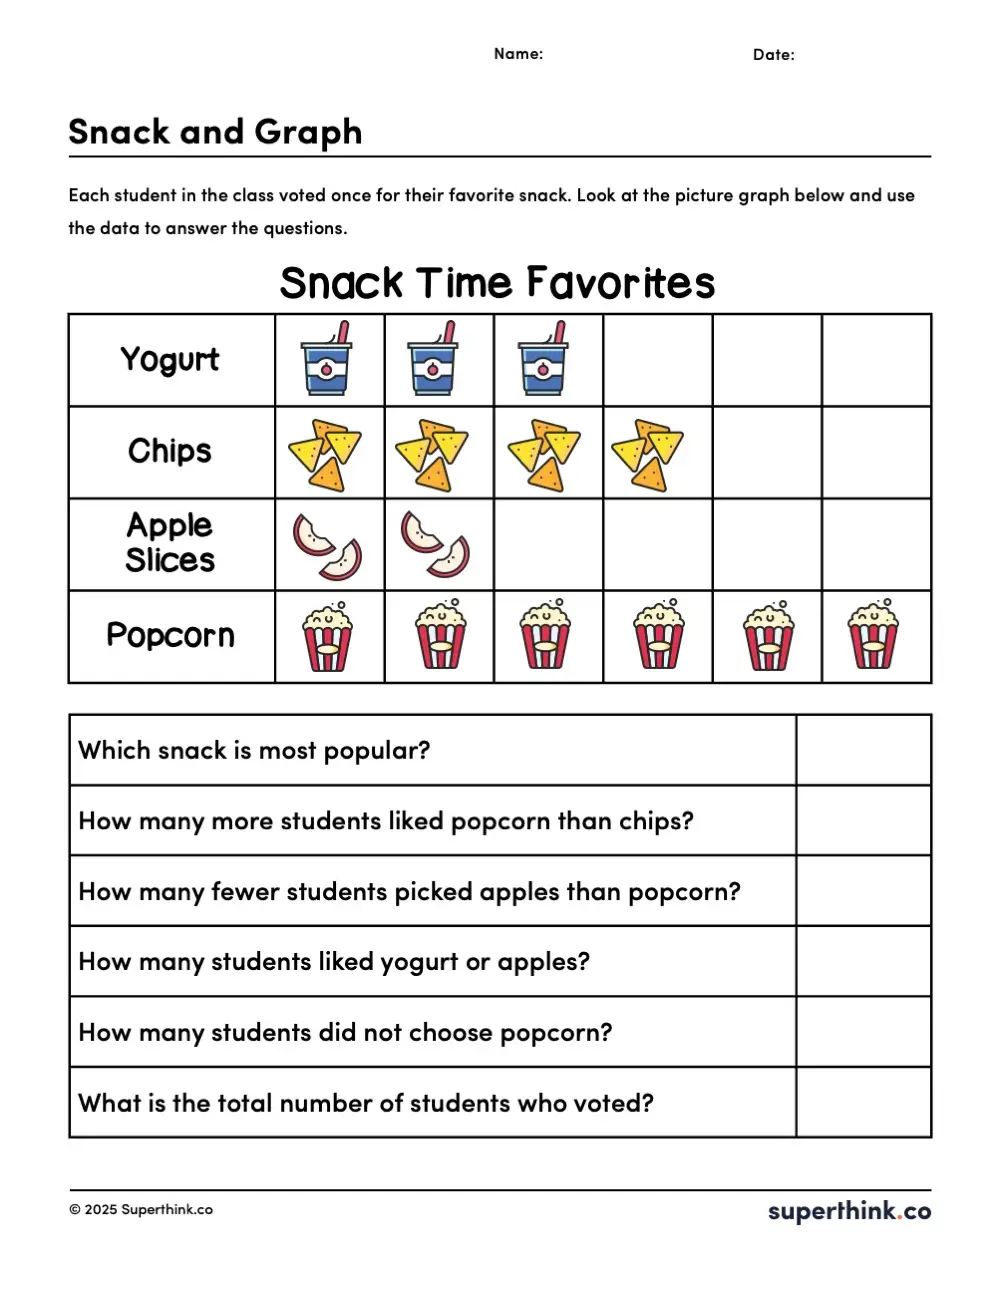
This picture graph worksheet helps math students practice reading data in visual form. This printable PDF shows a survey of a class’s favorite snacks in a fun picture graph using snack images. Students answer questions that involve comparing quantities, identifying the most popular snack, and using simple addition and subtraction. It’s perfect for building data and graph interpretation skills in a visual, hands-on way!
Snack and Graph: Free and Easy Picture Graph Worksheet
- .pdf in .zip folder
- Color, Black + White
- Answer Key
- Pages: 3
Grade Level Favorites!
View the gallery of all of our Superthink.co worksheets. Or, take a look at the most popular worksheets at this grade level:
Let's Keep Those Neurons Dancing!
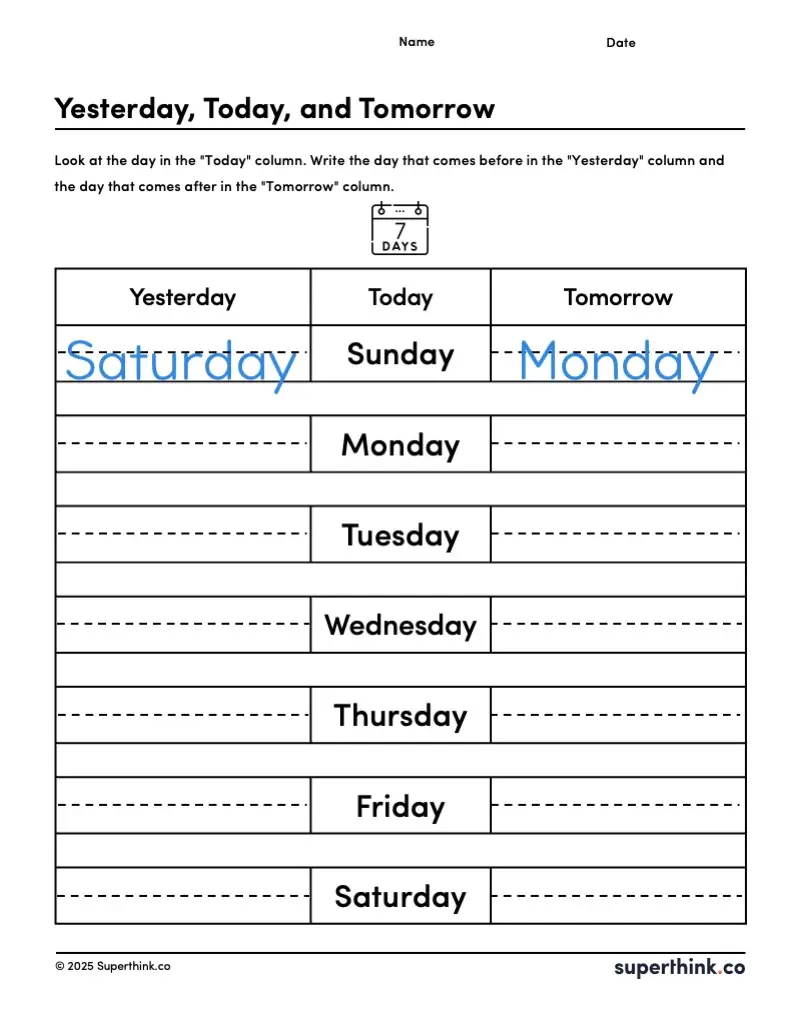
Yesterday, Today, Tomorrow: Free Days of the Week Worksheet
Superthink.co 2025. All Rights Reserved.

